|
|||
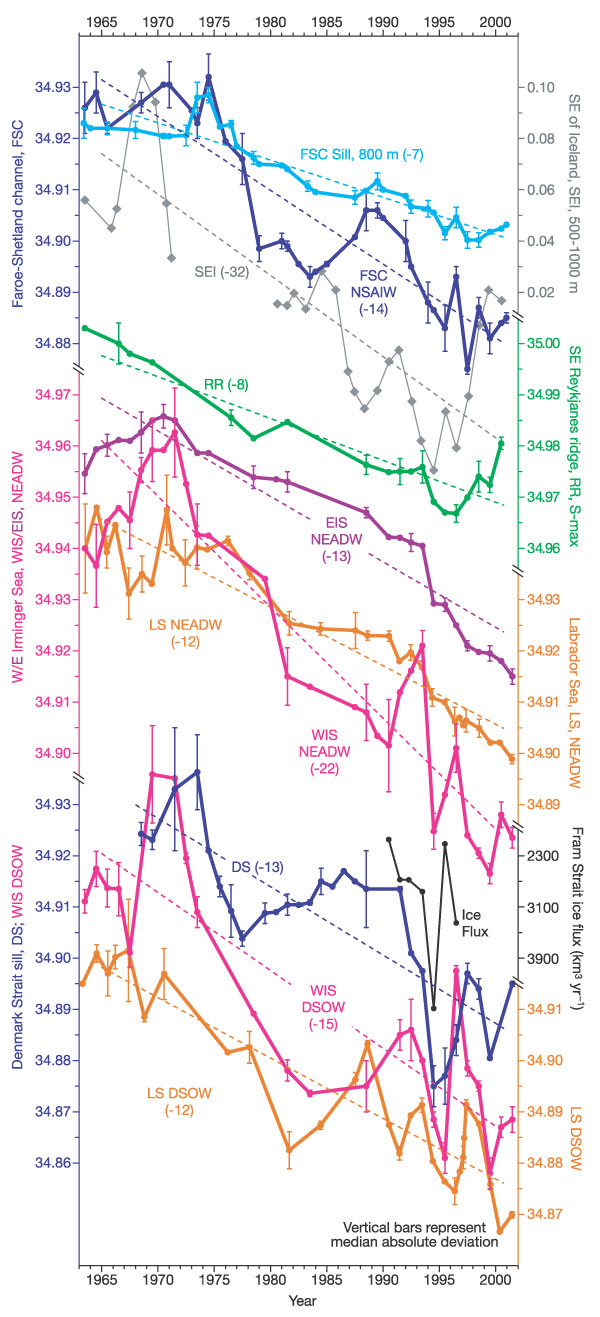
| Figure 2 Evidence of sustained and rapid freshening throughout the system of overflow and entrainment that ventilates the deep Atlantic. The salinity time series shown are plotted to a common scale (with the exception of SEI at half scale), and are colour- and letter-coded to identify their locations in Fig. 1b. The mean freshening rates in p.p.m. per decade listed against each curve are calculated for the common period 1965–2000, selected as the period of the most accurate salinity data set and the period during which the North Atlantic Oscillation (NAO) exhibited a sustained change between low-index and high-index extreme states. FSC sill and FSC NSAIW describe the freshening deep outflow through the Faroe–Shetland channel at sill depth and in the Arctic Intermediate Water layer, respectively20. SEI shows the depth-mean anomaly of salinity in the 500–1,000 m layer at the head of the south Icelandic basin, including data from the standard Icelandic Stokksnes section, and so represents the salinity of the water masses likely to be entrained into the eastern overflow as it leaves the Faroe Bank channel. (The short-term spike of the 'great salinity anomaly' of the mid-1970s has been omitted). RR represents the product of that mixing, describing the salinity trend in the deep salinity maximum which marks the core of ISOW against the deep eastern flank of the Reykjanes Ridge at 57–59°N, 27–31°W. EIS NEADW, WIS NEADW and LS NEADW describe salinity time series at successive stages in the spreading of the eastern overflow as it continues into the Irminger Sea, shoals and alters along the Greenland slope and ultimately forms the Deep Water of the Labrador Sea. Curves DS, WIS DSOW and LS DSOW describe the salinity trends of the Denmark Strait overflow at the sill (depths of 500–550 m at T < 0 °C), in the 0–200 m near-bottom layer where the overflow plume descends the slope off southeast Greenland, and in the abyssal layers of the Labrador Sea, respectively. The observed annual mean ice flux through the Fram Strait, 1990–97, is shown for comparison17 (scale inverted) as a possible remote cause of the enhanced freshening along this path in the mid-1990s. | |||