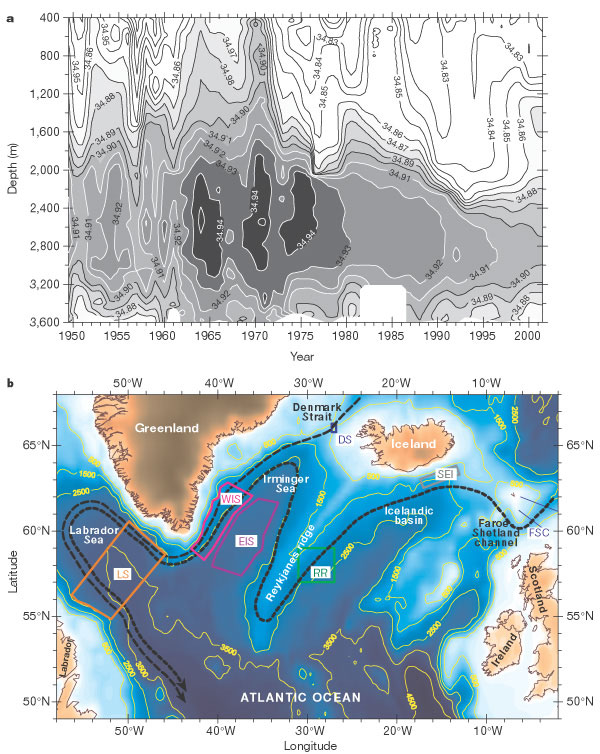
Figure 1 The origins of deep freshening in the
Labrador Sea. a, Rapid and long-term freshening throughout the
water column of the Labrador Sea. Shown are salinity changes since 1950 in
the central part of the basin, with values >34.87 shaded. The data set
was selected to lie within the 3,300-m isobath of the Labrador Sea, and
the plot represents the median values of vertical property profiles,
binned according to  2
density intervals. b, The two main overflows across the
Greenland–Scotland ridge and their spreading pathways to the Labrador
Sea (heavy dashed lines). Letters identify the locations of time series
used in Fig. 2 to describe their changing characteristics en route. 2
density intervals. b, The two main overflows across the
Greenland–Scotland ridge and their spreading pathways to the Labrador
Sea (heavy dashed lines). Letters identify the locations of time series
used in Fig. 2 to describe their changing characteristics en route. |